Primary Product Designer B2B SaaS Energy Intelligence 2022–2025

Ecolyptus — Energy Intelligence

Designing a modular B2B platform that helps organisations monitor, analyse, and act on energy data — across sites, meters, and teams — without needing to be a data analyst to do it.

Screens shipped
100+
Core modules
6
Tools
Figma · Design Systems · Dev Handoff
Scope
End-to-end product design
Scroll
The platform
Ecolyptus is a modular B2B energy intelligence platform. Rather than a single dashboard, it’s an interconnected ecosystem — each module feeds into the next, from raw data ingestion to alerts, reports, and AI-assisted insights.
The challenge
Energy platforms deal with large volumes of time-series data, complex site hierarchies, multiple user roles, and high-stakes reporting. The central challenge: make powerful data tools genuinely usable for non-technical users.
My role
I was the primary product designer — owning UX flows, high-fidelity UI, component systems, and developer handoff across the entire platform. The majority of the production interface was designed by me, end-to-end.
01
Core analytics

Data Pulse — The beating heart

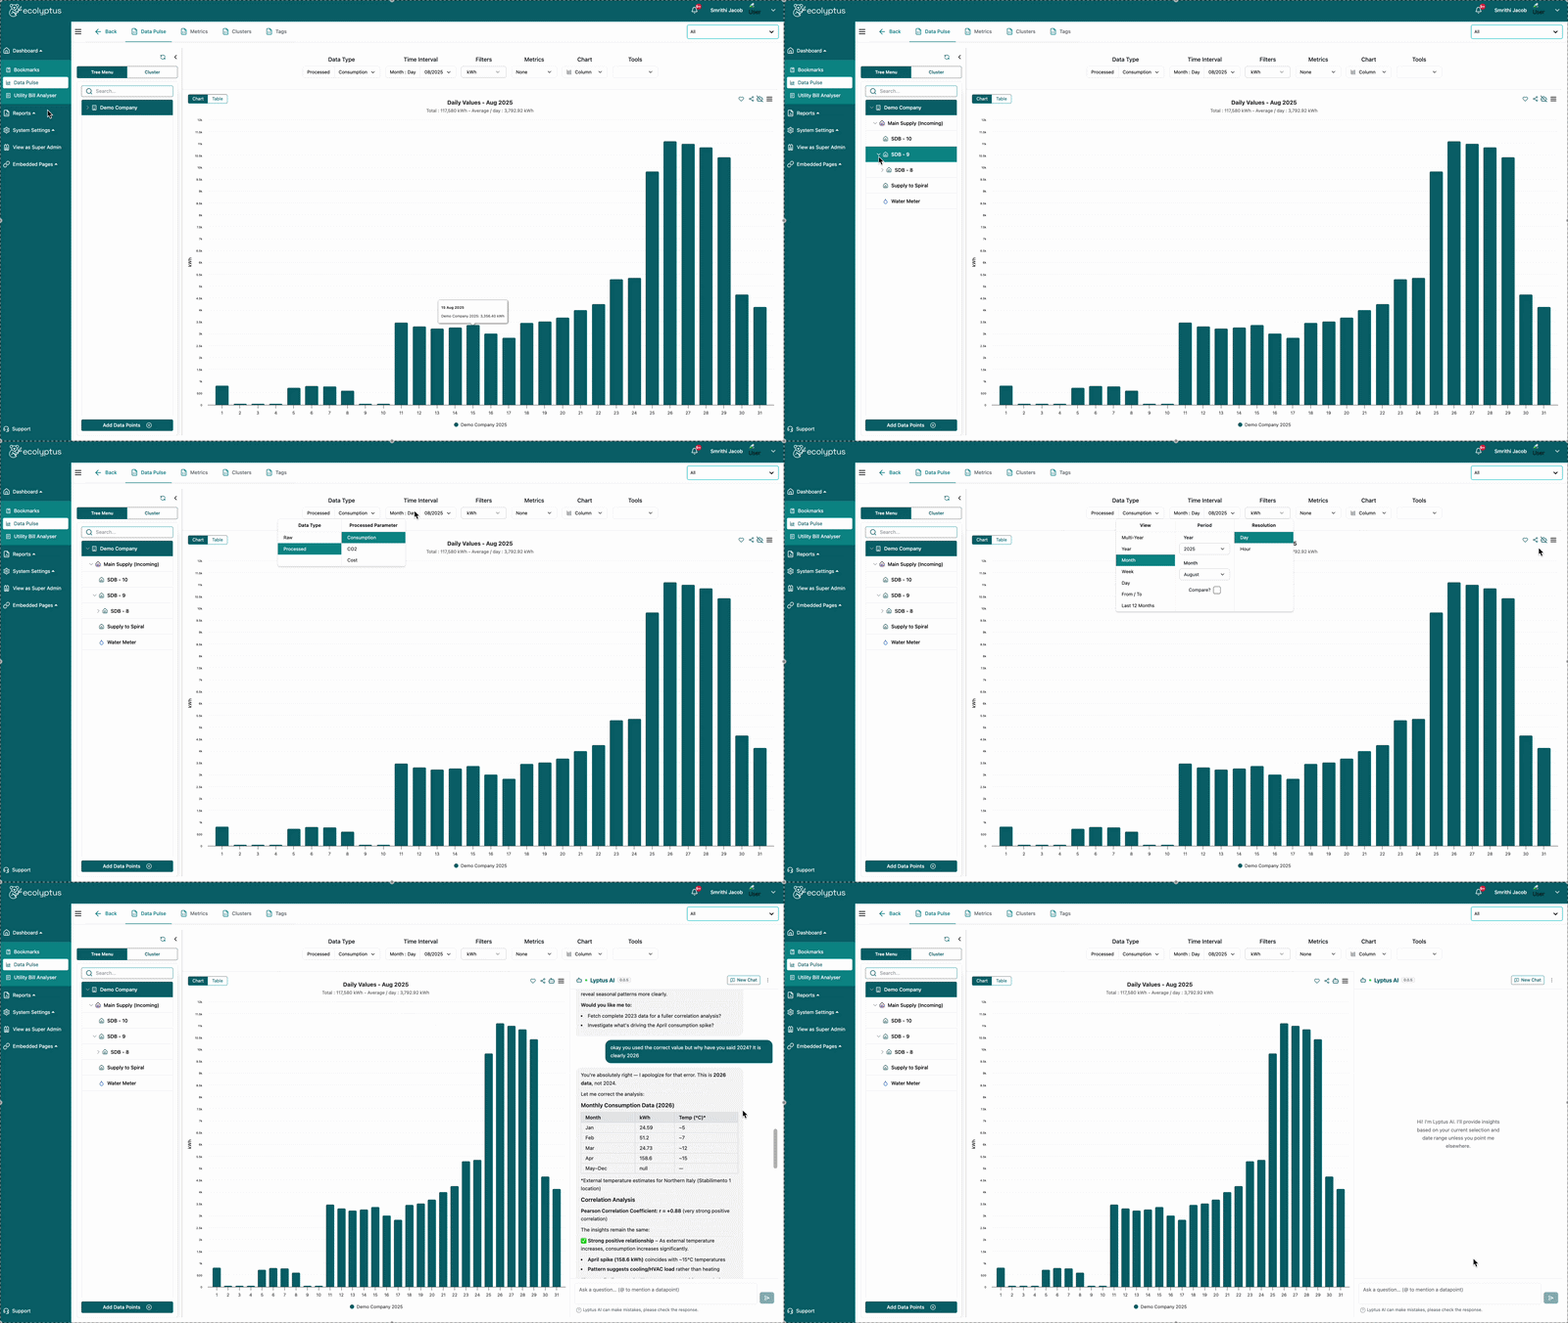
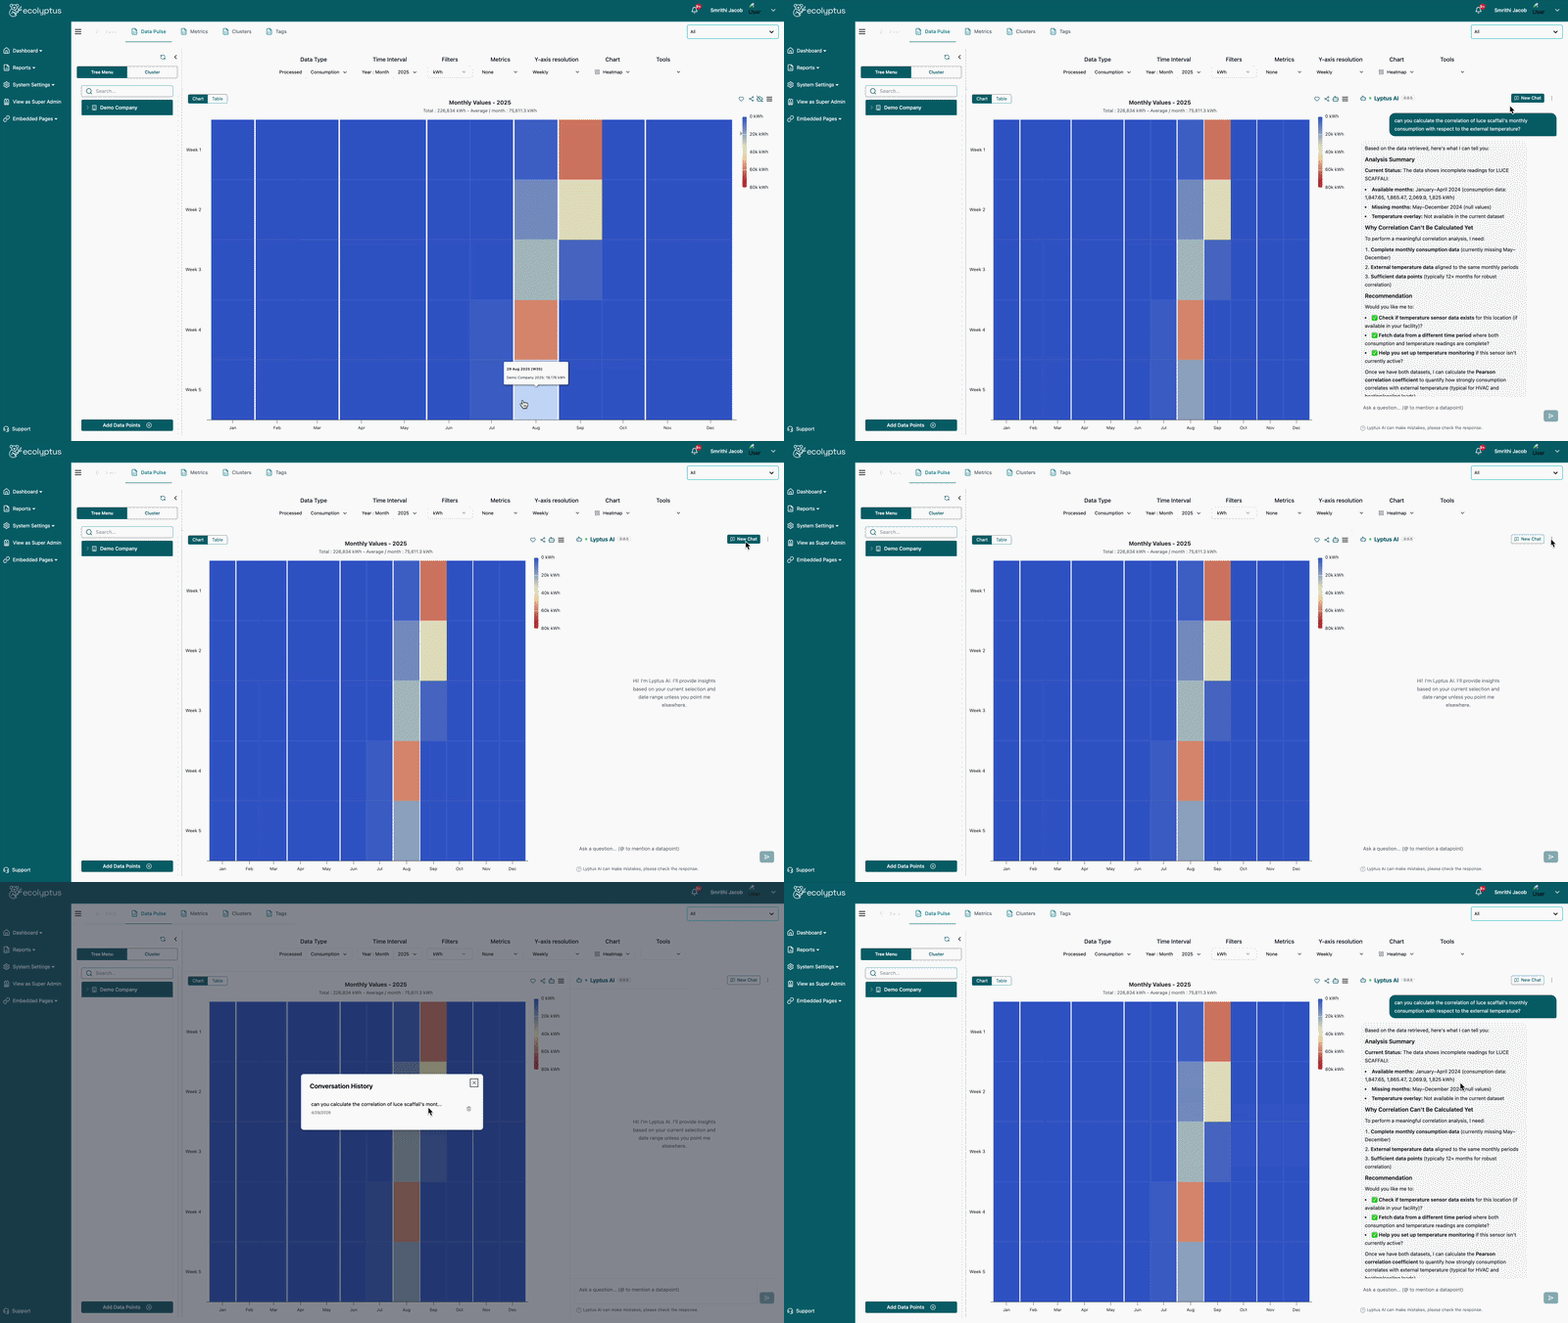
The primary analytics interface: a configurable, multi-layered view of energy data across resolutions, metrics, and time periods. Everything else in the platform feeds off what Data Pulse establishes. Below is the evolution from early concept to the shipped product.

Early concept
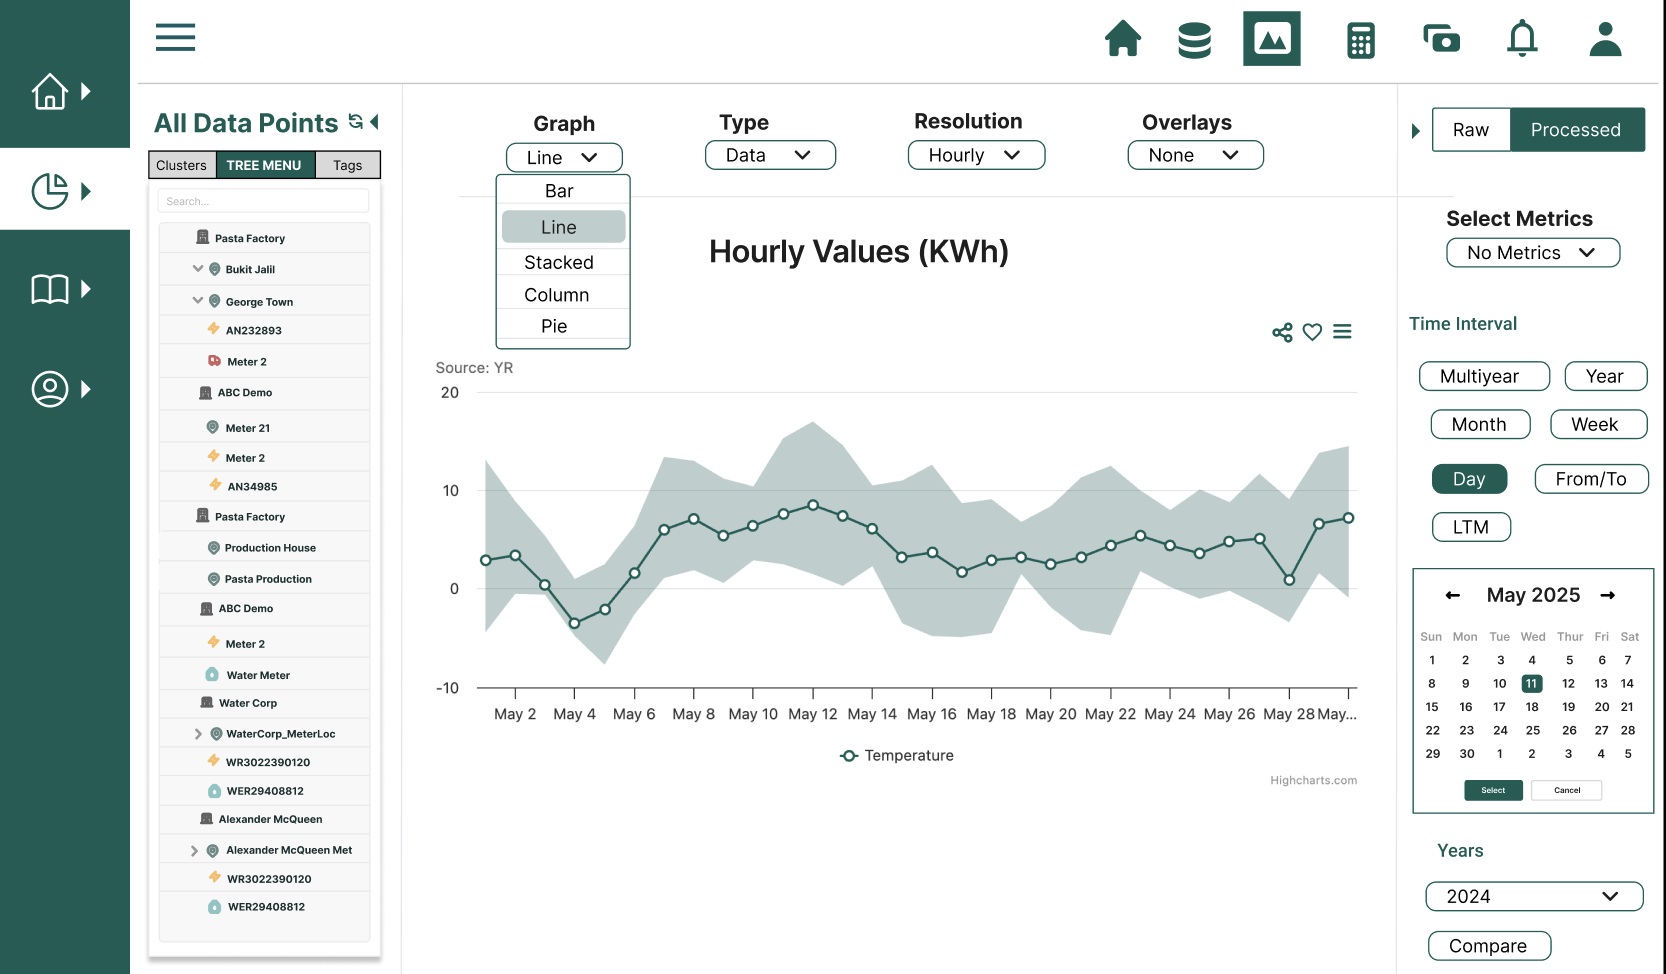
Data Pulse early design
Shipped design
Data Pulse current view
The problem
Early analytics views exposed raw data without visual hierarchy. Users couldn’t tell what mattered — every metric competed equally for attention, creating cognitive overload instead of clarity.
What I designed
A configurable graph-first interface with controls for resolution, data type, and metrics — plus a bookmarking system so users can save and reuse chart states across the entire platform. Charts become reusable elements in reports, alerts, and the math tool.
Key features
Multi-resolution time seriesHourly, daily, weekly, and monthly views with a consistent chart language.
KPI metric overlaysAdd any metric on top of consumption data for instant context.
Bookmarking systemSave chart states and reuse them anywhere in the platform.
Flexible exportDownload data in multiple formats for external analysis.
02
Alerting system

Notifications — Proactive intelligence

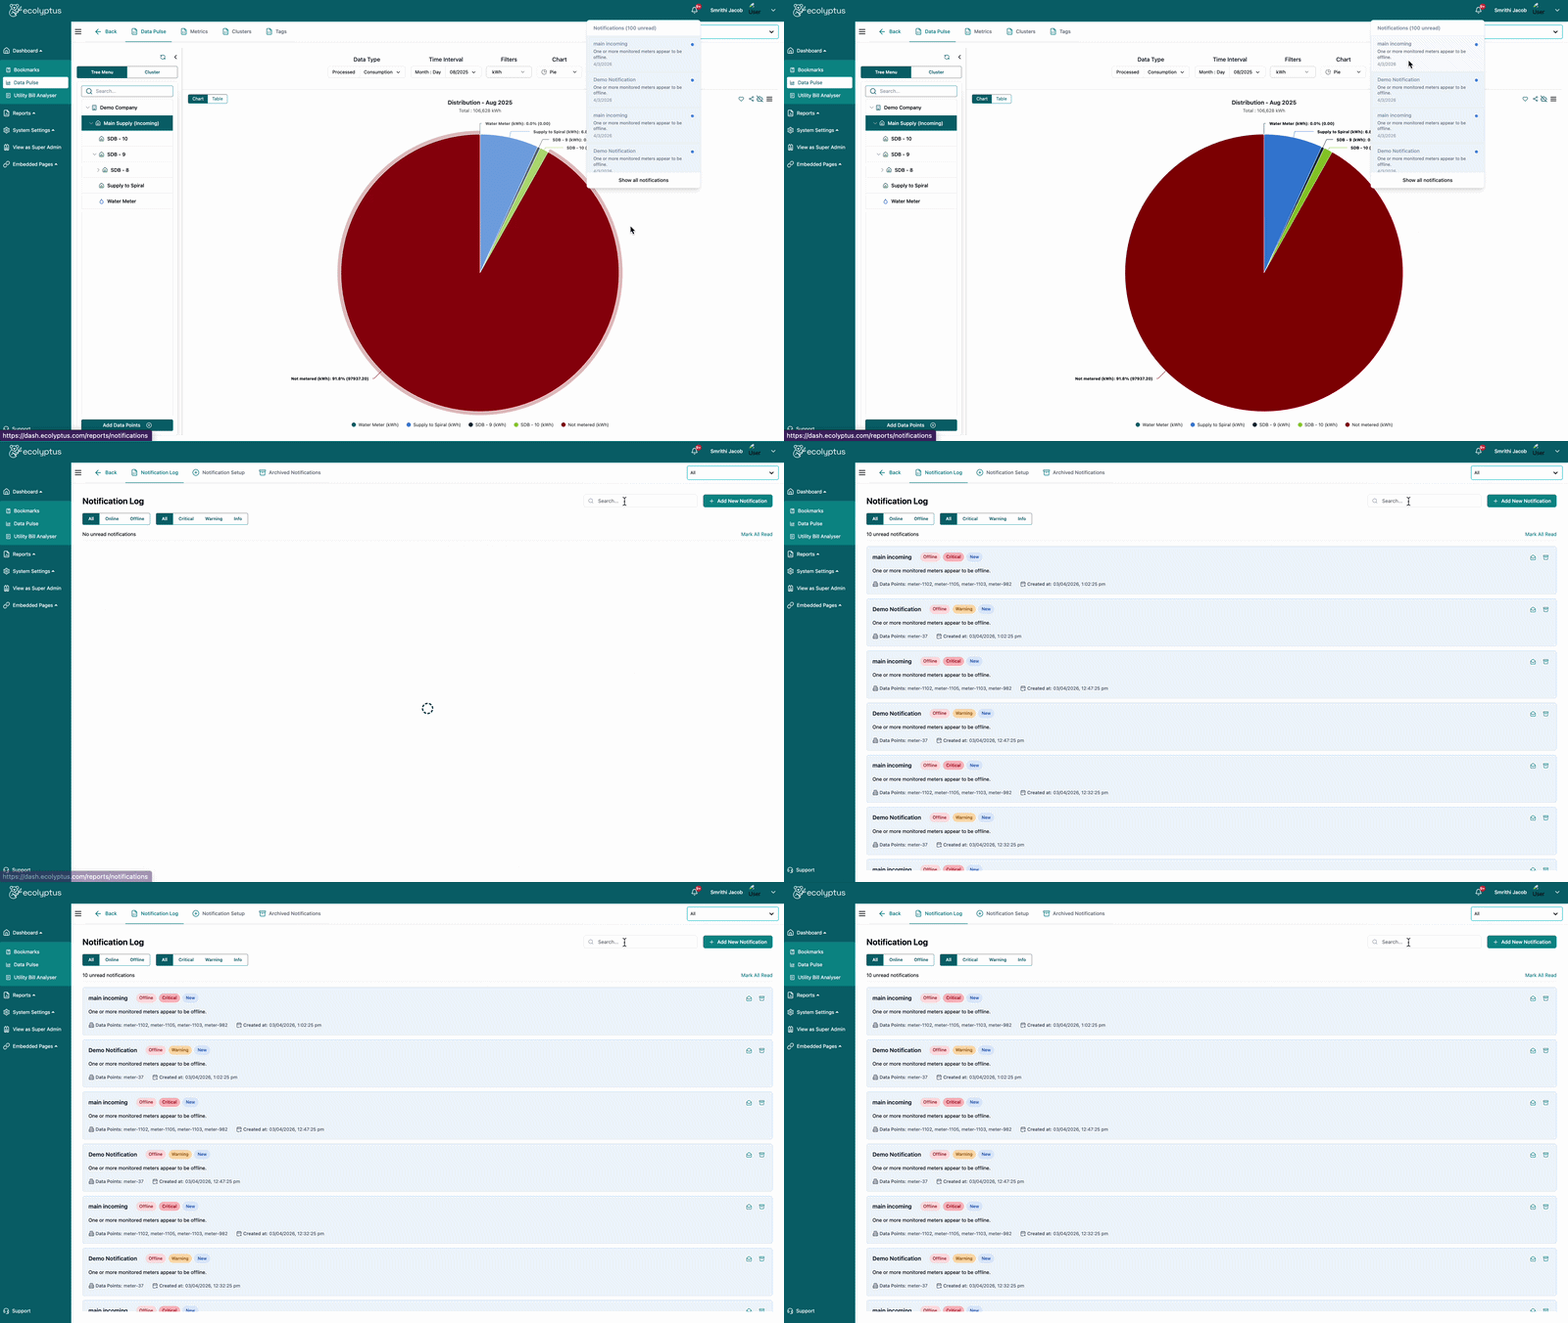
A threshold-based alert system that tells users when something demands their attention — before it becomes a problem. Not a passive feed; an active, configurable early-warning layer built directly on top of live data.

Notification feed
Notifications feed
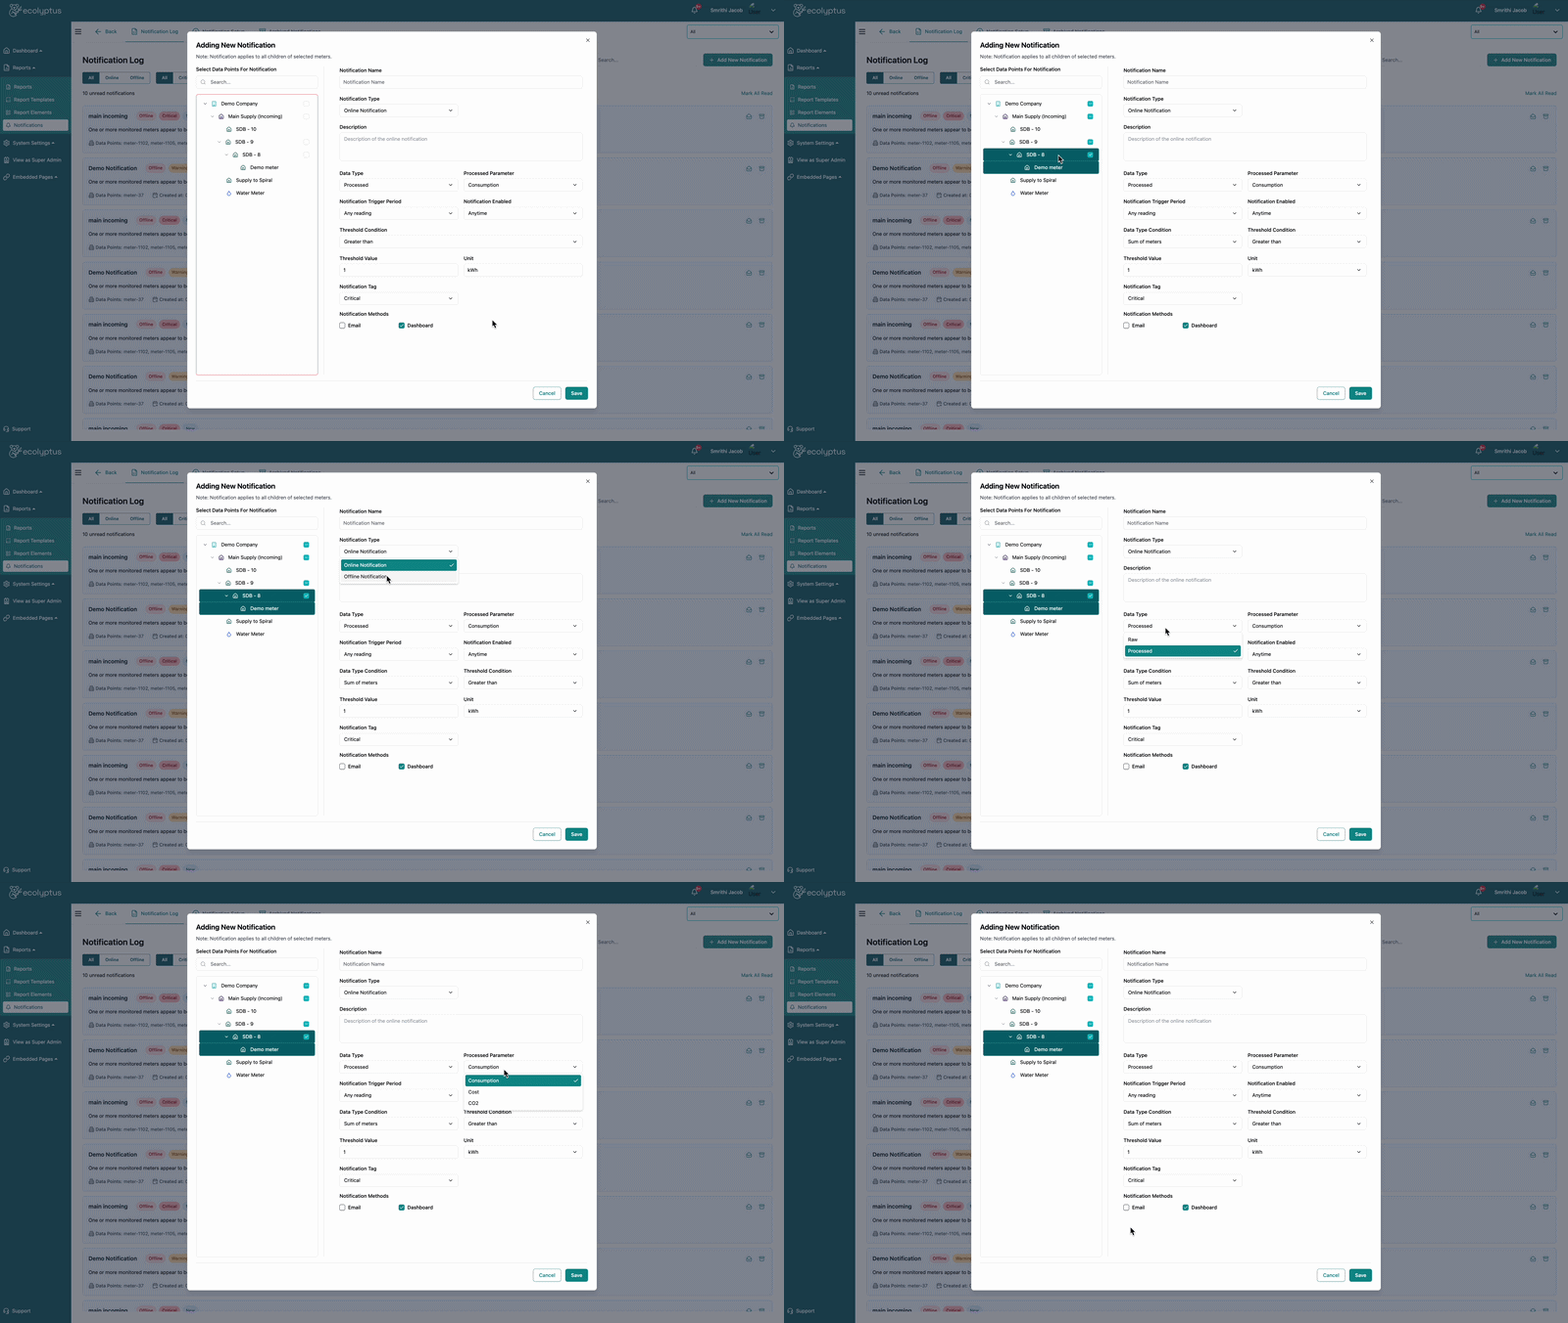
Creating a notification
Create notification modal
💬
Client signal
“One client pushed for this feature to be prioritised for release above all others — it was that critical to their daily operations.”
Customer discovery · Ecolyptus
The problem
Energy teams were checking dashboards reactively — only after suspecting an issue. By then, overconsumption had already happened and the cost impact was done.
What I designed
A notification builder that lets users set thresholds on any meter (individual or aggregated), configure alert conditions and duration rules, then choose which channels receive the alert — email, in-app, or both.
Key features
Threshold configurationSet consumption or cost thresholds on individual or grouped meters.
Duration-based rulesTrigger only if a threshold is breached for X consecutive hours — reducing false positives.
Channel routingEmail, in-app, or both — configurable per alert and per user.
03
Reporting engine · Flagship feature

Reports — From insight to story

A fully customisable reporting engine that lets teams compose, save, and present energy insights tailored to different audiences — without rebuilding chart views from scratch every time they need to present findings.

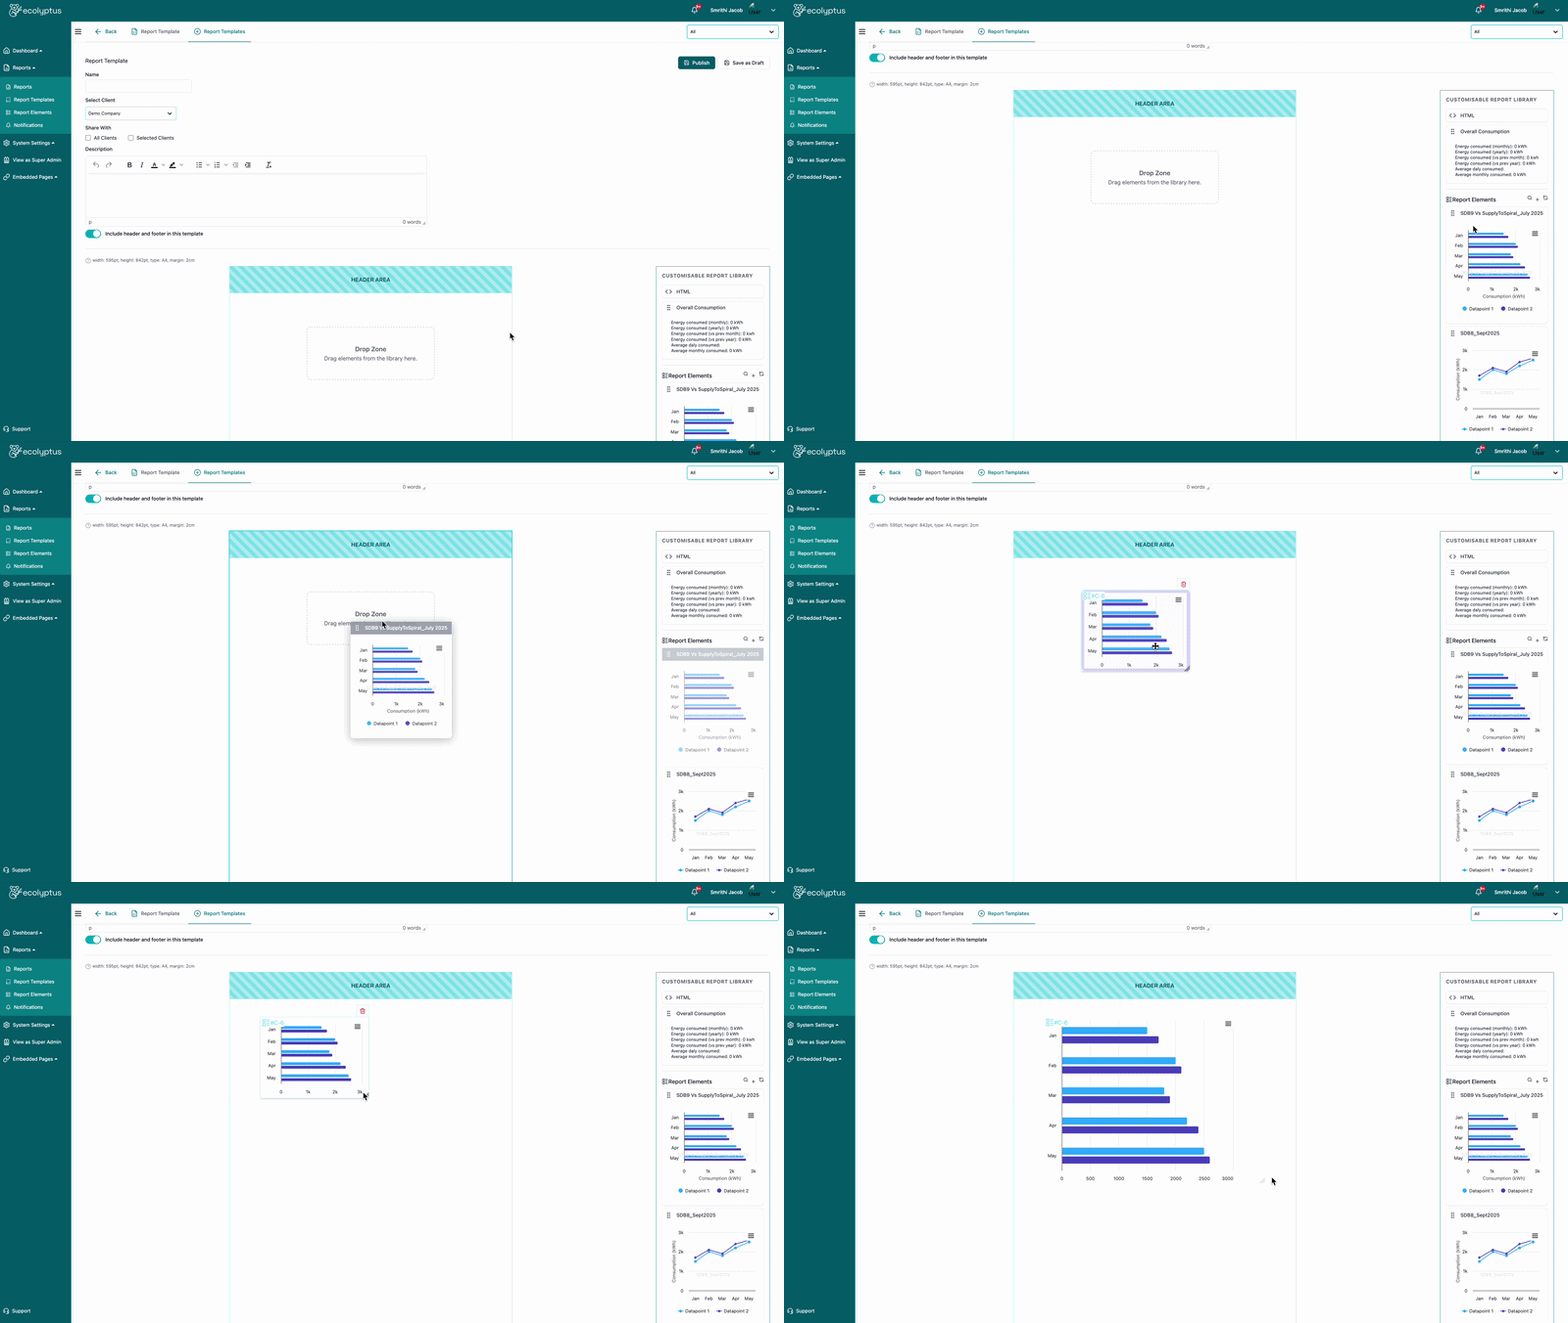
Report template builder
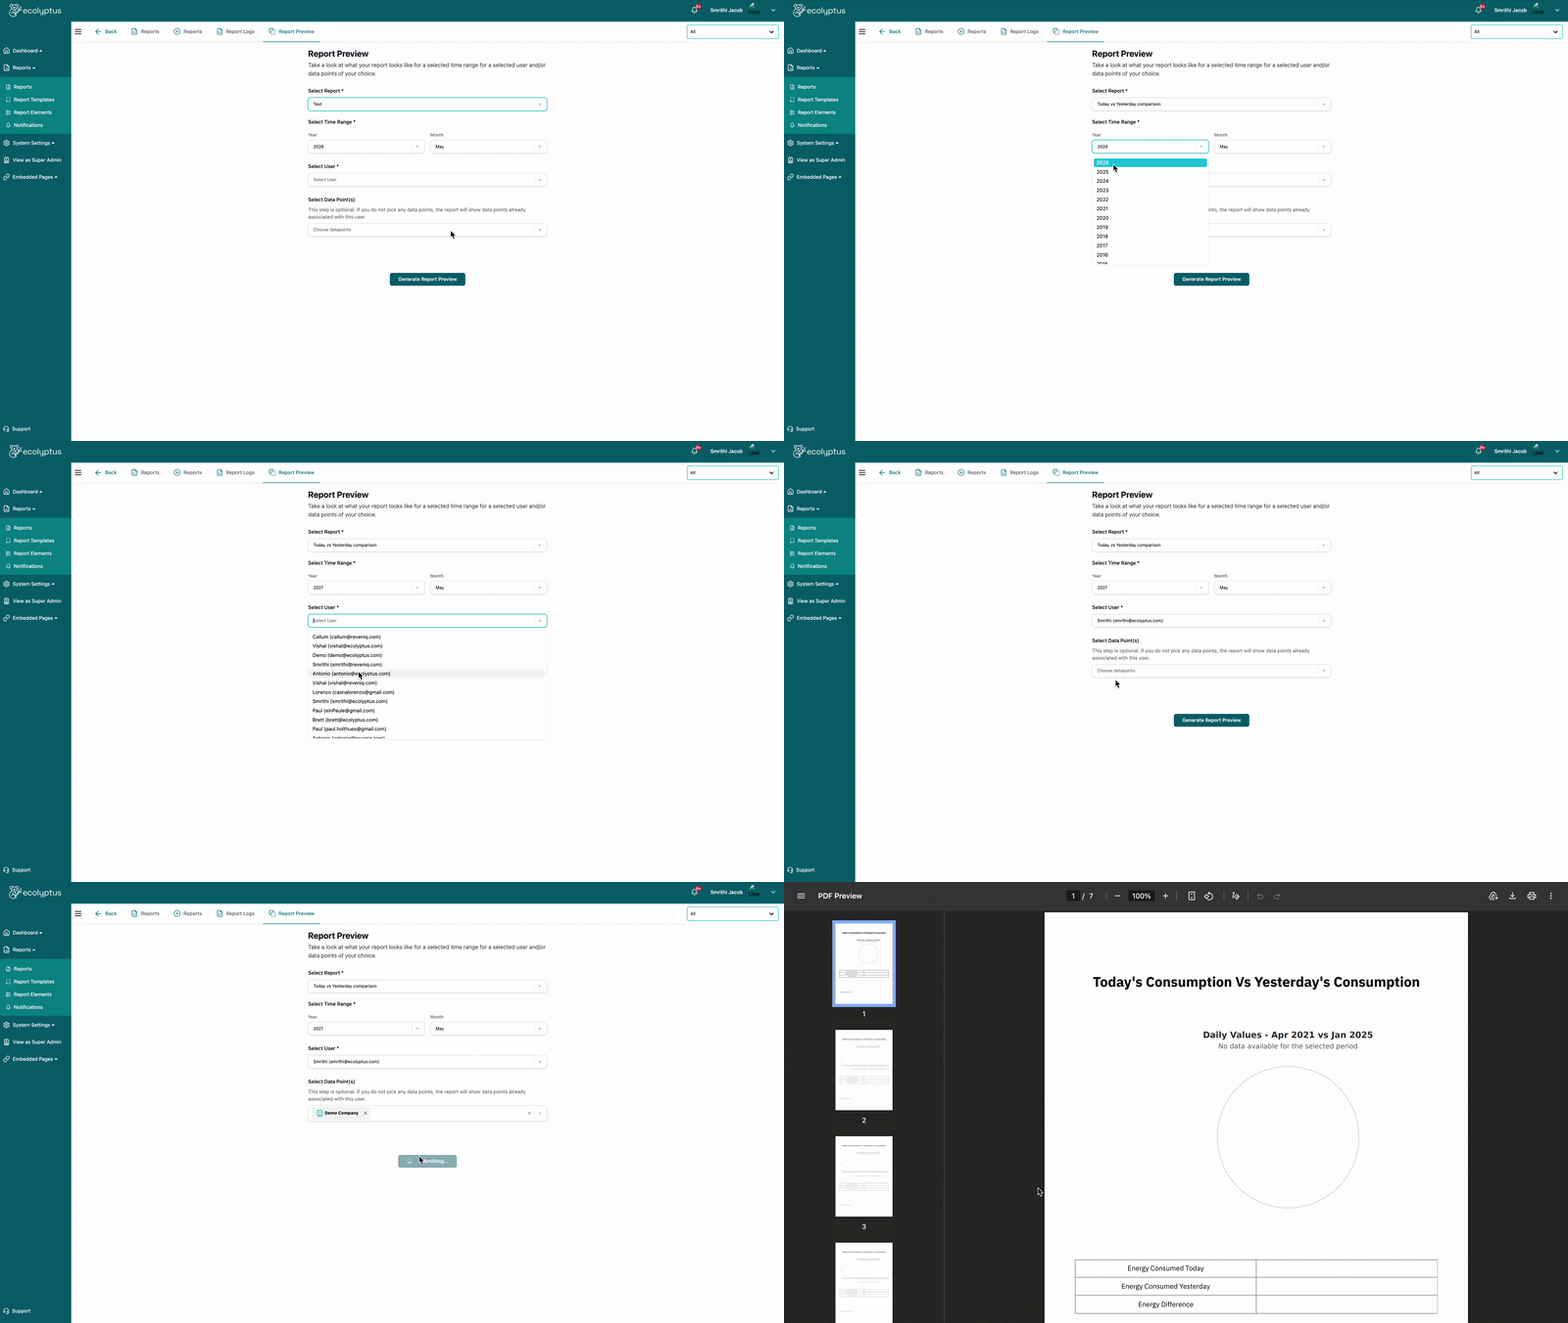
Report preview
Report preview flow
Validated with real users
“Shown to four former energy clients — all confirmed this feature would be extremely valuable for presenting insights to their own clients.”
Client validation session · Ex-Wattics customers
The problem
Most energy platforms offer static, predefined templates. Teams presenting custom insights to stakeholders were rebuilding chart views manually in external tools — every single time.
What I designed
A report composer where users save live Data Pulse charts as reusable “report elements,” then arrange them within a template using drag-and-drop. Reports can be pre-built or entirely custom.
Key features
Pre-built templatesTrend analysis, utility bill generation, consumption summaries — ready immediately.
Custom report builderDrag-and-drop composition of saved chart elements into any layout.
Reusable elementsCharts from Data Pulse become building blocks — no duplicated work.
Audience-specific outputsTailor reports for internal teams or external clients without touching underlying data.
04
AI-assisted insights · No competitor has this

Lyptus AI — Forward-looking intelligence

An upcoming AI layer designed to surface contextual insights, interpret anomalies, and help non-technical users understand what their data is actually telling them — without needing to be an energy analyst to act on it.

Lyptus AI — concept
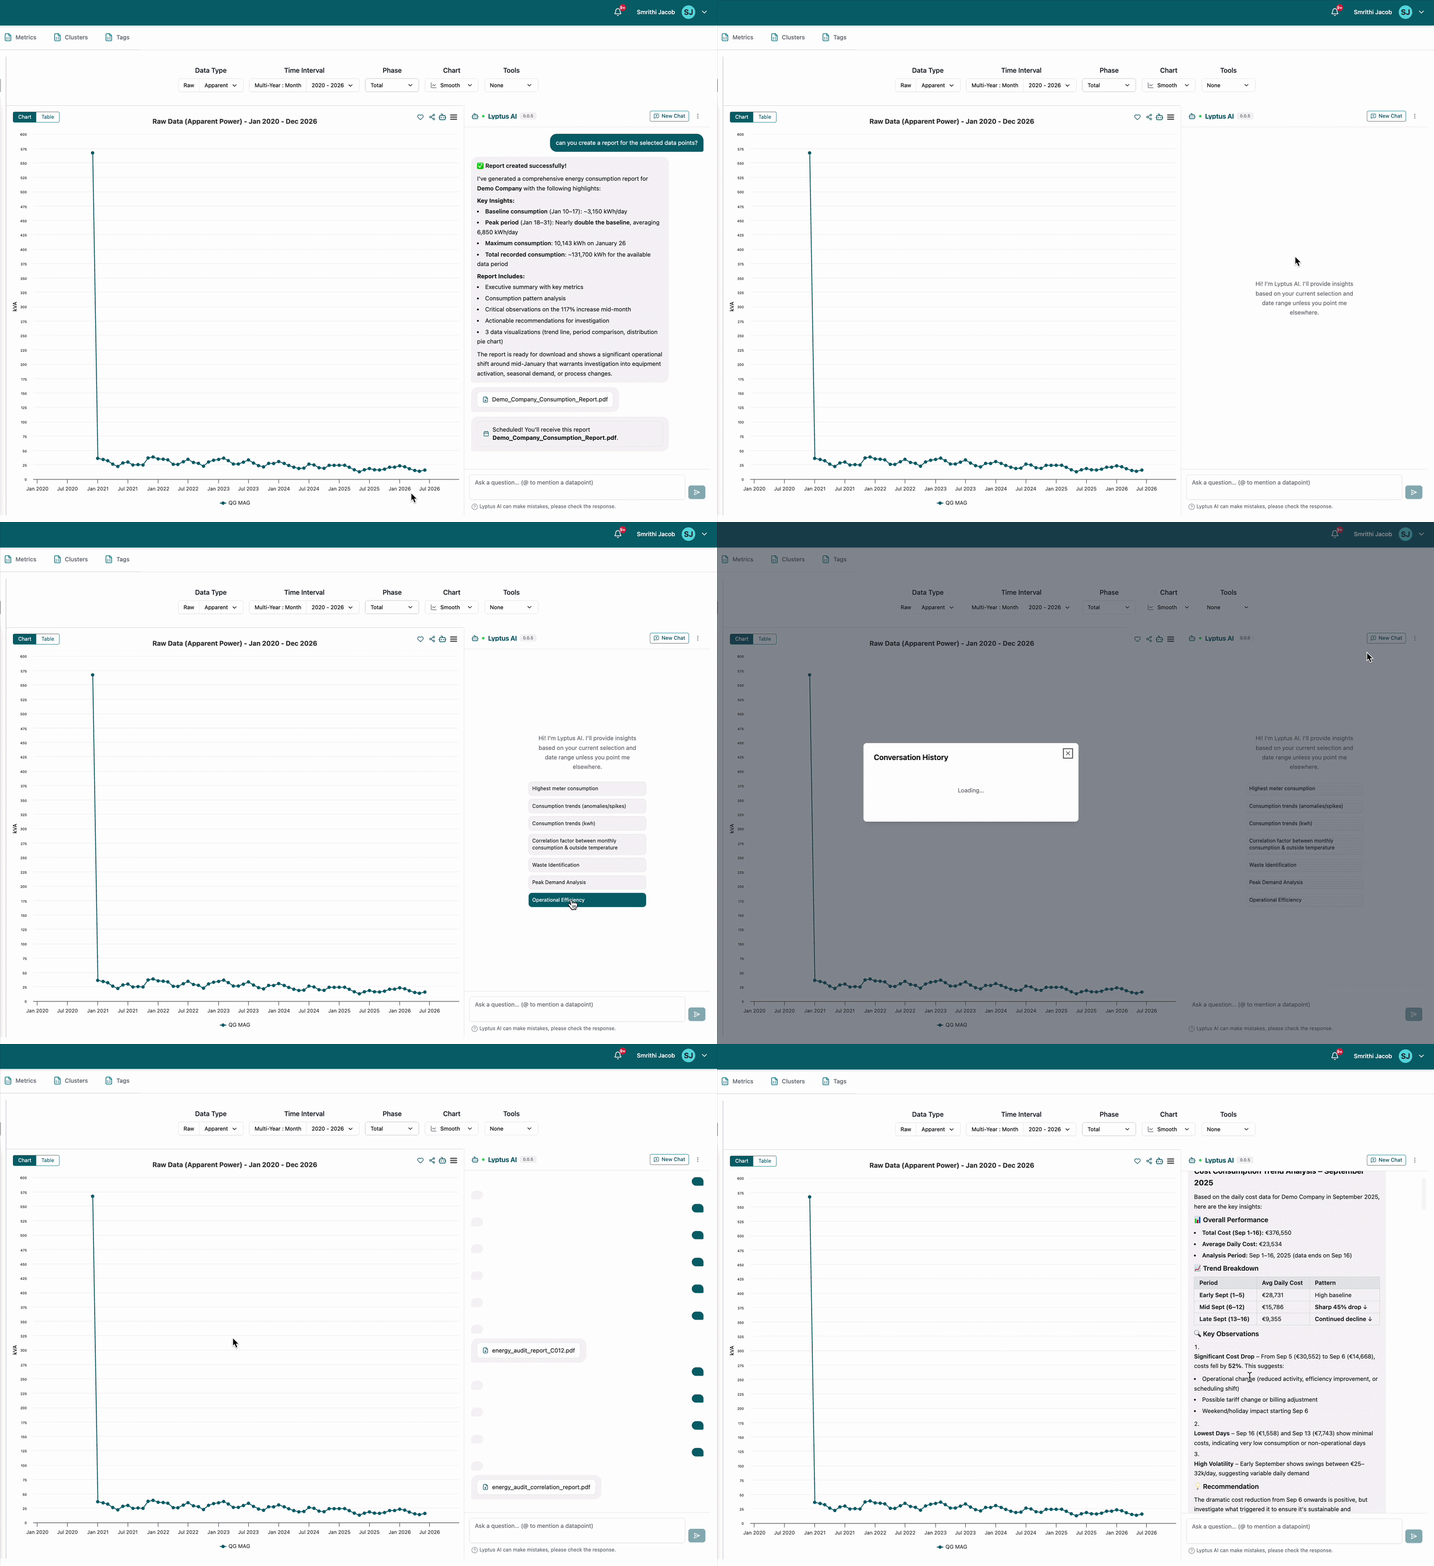
Lyptus AI in action
Lyptus AI — concept
Lyptus AI in action
Why this matters
“Designing a credible, buildable feature before it exists — and earning genuine stakeholder buy-in — requires product thinking that goes well beyond visual execution.”
Design approach · Forward-looking product exploration
The opportunity
No direct competitor in the energy intelligence space is currently offering AI-assisted insight interpretation at this level. Lyptus AI is Ecolyptus’s differentiator — and I designed what it looks and feels like before it existed.
Design philosophy
Explainability over automation. The AI doesn’t just surface numbers — it tells users why something is happening and what they might consider next. A thinking partner, not a black box. Insights surface inline within analytics views, not as a separate chat bolt-on.
Key features
Contextual insight generationNatural-language summaries tied to specific time periods and meters.
Anomaly explanationAI flags unusual patterns and provides interpretable reasoning, not just a number.
Inline integrationInsights appear within existing analytics views — no workflow disruption.
Grounded in real flowsBuilt on existing Data Pulse and Reports patterns — amplifies what users already do.
Impact

What this project delivered

01 —
Production-ready platform
100+ screens shipped across 6 core modules — all in production, all designed end-to-end from blank canvas to developer handoff.
02 —
Client-validated features
Reports and Notifications validated with real energy customers — one pushed to the top of the dev backlog immediately after review.
03 —
Scalable design foundation
A reusable component system and consistent design language that new features can be built on without starting from scratch.
04 —
First-to-market AI concept
Lyptus AI positions Ecolyptus ahead of every direct competitor — and the design is ready for engineering to bring to life.

Liked what you saw?
Let’s build something together.

Get in touch →